Section 3: Graphing Linear Inequalities
It is important that you watch the video first.
Graph Linear Inequalities in Two Variables
Linear inequalities are written in the same form as linear equations with either <, <, >, or > replacing the = sign.
Examples are shown below:
ax + by < c
ax + by > c
ax + by < c
ax + by < c
Graphing Solution Sets of Linear Inequalities
- Replace the inequality symbol with an equal sign and graph the related equation.
- Plot two points to determine the line.
- If the inequality symbol is < or >, draw a dashed line to show that points on the line are not solutions of the inequality.
- If the inequality symbol is < or > , draw a solid line to show that points on the line are solutions of the inequality.
- The graph consists of a shaded region that is either above or below the line. If the line is solid, the line is also considered part of the graph. To determine which region to shade, select a point that is not on the line as a test point.
- Substitute the coordinates of the point in the inequality to determine whether that point is a solution. If the point is a solution, shade the portion of the graph containing the test point. If not, shade the other side of the line.
Example 1:
Graph the inequality. y < x
|
Solution: |
|
| Replace the inequality symbol with an equal sign and graph the related equation. | y = x |
| Plot two points to determine the line. | We can plot the points (0, 0) and (1, 1) |
|
Since the inequality symbol is <, draw a solid line to show that points on the line are solutions of the inequality. |
|
|
The graph consists of a shaded region that is either above or below the line. If the line is solid, the line is also considered part of the graph. To determine which region to shade, select a point that is not on the line as a test point. |
Test Point: (3, 0) |
|
Substitute the coordinates of the point in the inequality to determine whether that point is a solution. If the point is a solution, shade the portion of the graph containing the test point. If not, shade the other side of the line. |
0 < 3 is a true statement. We should shade all points on this side of the line. |
Example 2: Graph each of the following inequalities
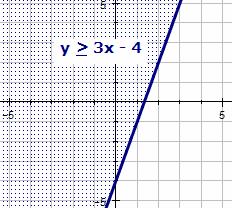
- y > 3x – 4 and
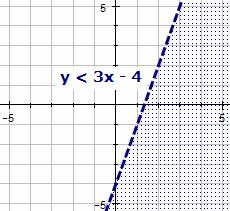
- y < 3x – 4.
|
Solution: | |
|---|---|
|
Replace the inequality symbol with an equal sign and graph the related equation. This same equation can be used for each inequality. |
y = 3x – 4 |
| Plot two points to determine the line. | We can plot the points (0, –4) and (1, –1) |
|
For the first inequality, since the inequality symbol is >, draw a solid line to show that points on the line are solutions of the inequality. The second inequality will use a dashed line since the inequality symbol is <. |
|
|
The graph consists of a shaded region that is either above or below the line. To determine which region to shade, select a point that is not on the line as a test point. |
Test Point: (0, 0) |
| Substitute the coordinates of the point in the inequality to determine whether that point is a solution. If the point is a solution, shade the portion of the graph containing the test point. If not, shade the other side of the line. |
> 3x – 4: 0 > –4 is a true statement. We should shade all points on this side of the line.
0 < –4 is a false statement. We should shade all points on the other side of the line. |
 |  |
|---|
Test Your Knowledge by opening up the Test Yourself Activity.

Contact Us
For more information about the TSI Assessment and how to register, visit https://www.hccs.edu/resources-for/current-students/testing-services/ or email hcc.testing@hccs.edu